How to install the Morpheus Plugin
Prerequisites
Before proceeding with the installation, ensure that the following prerequisites are met:
Morpheus instance: A configured Morpheus instance (outside the scope of this manual).
Exivity instance: A configured Exivity instance.
Morpheus report: Defined and prepared within Exivity.
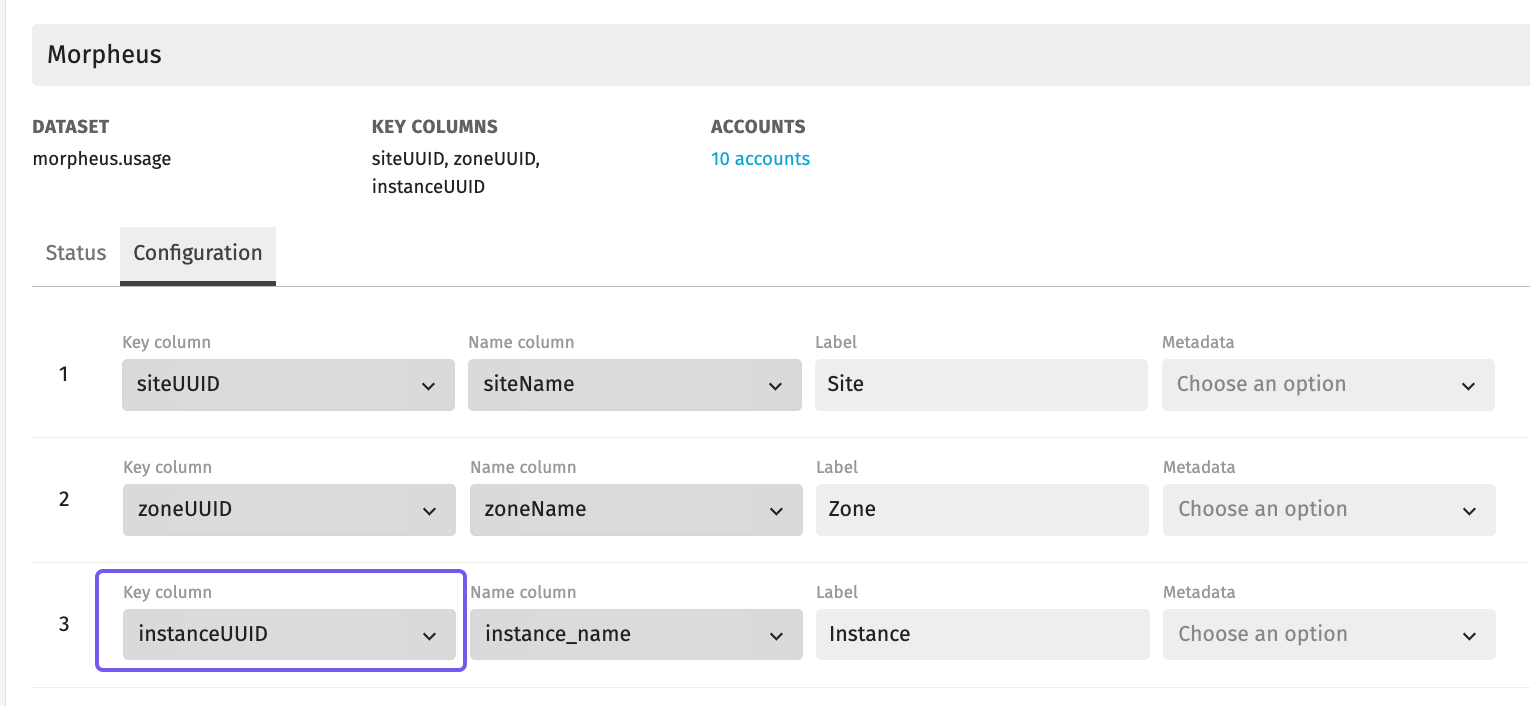
- Important: One of the report hierarchy levels must correspond to the Instance in Morpheus, and the report Key column must align with the
InstanceUUIDin Morpheus, for the Name column it can be set to a column with a friendly name.
Exivity FinOps plugin JAR file: Ensure that you have downloaded the Exivity FinOps plugin JAR file.
Installing the Exivity FinOps Plugin in Morpheus
Follow these steps:
- Log in to your Morpheus instance.
- Navigate to Administration > Integrations.
- Click on the Plugins tab.
- Click the ADD button.
- Click Add File and navigate to the directory where the Exivity FinOps plugin JAR file is stored.
- Click the UPLOAD button.
Configuring the Exivity FinOps Plugin
Once the installation is complete, you should see the Exivity FinOps plugin in the plugin list with a green icon, indicating a successful installation.
![]()
Click on the Edit icon to configure the plugin.
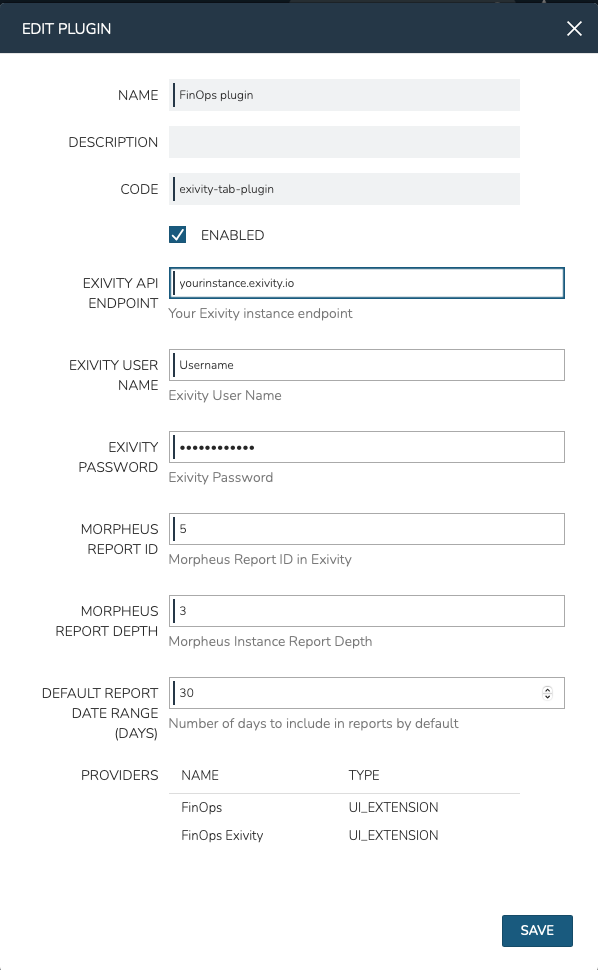
- In the EDIT PLUGIN window, populate the required parameters:
EXIVITY API ENDPOINT: Enter your Exivity instance endpoint.
EXIVITY USER NAME: Provide the Exivity username (ensure it has appropriate access to the Morpheus report).
EXIVITY PASSWORD: Enter the password for the Exivity user.
MORPHEUS REPORT ID: Enter the Morpheus report ID from Exivity.
To obtain the Morpheus report ID, navigate to DATA PIPELINES > REPORTS in Exivity. In the REPORT DEFINITIONS section, select your Morpheus report. The report ID can be found at the end of the URL.
![]()
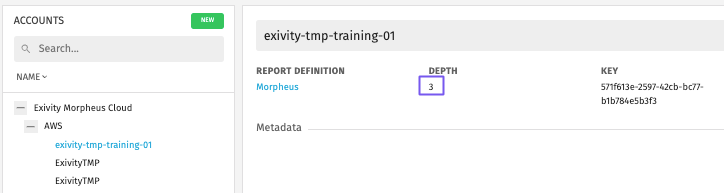
MORPHEUS REPORT DEPTH: Specify the Morpheus instance report level.
To obtain this value, navigate to ACCOUNTS > OVERVIEW in Exivity and browse the report hierarchy levels until you locate an account at the instance level. The depth of the account can be found in the Overview section.
DEFAULT REPORT DATE RANGE (DAYS): Set the desired default report date range (Optional).
Using the Exivity FinOps Plugin
The Exivity FinOps plugin provides two interfaces: Instance View and FinOps Dashboard.
Instance View
To access the Instance View:
- In Morpheus, navigate to Provisioning > Instances.
- Select the instance you wish to analyze.
- Click on the FinOps Exivity tab.
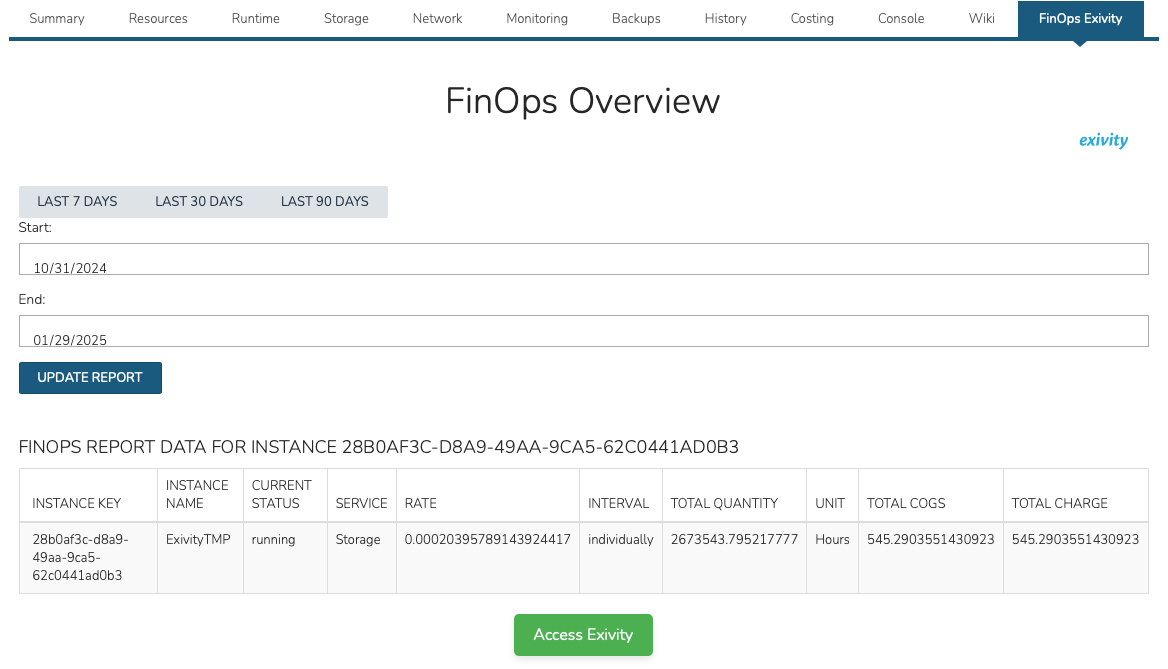
In the Instance View, you will see cost and usage data directly within Morpheus. Key features include:
- Cost and Usage Breakdown: View detailed cost and usage data at the individual instance level.
- Date Range Selection: Filter the report view using preset options like "Last 7 Days," "Last 30 Days," "Last 90 Days," or specify a custom date range.
- Direct Exivity Access: Click on the Access Exivity button to navigate to the Exivity platform for deeper analysis.
FinOps Dashboard
To access the FinOps Dashboard:
- In Morpheus, navigate to Operations > Analytics.
- Under FINOPS ANALYTICS, click on FinOps.
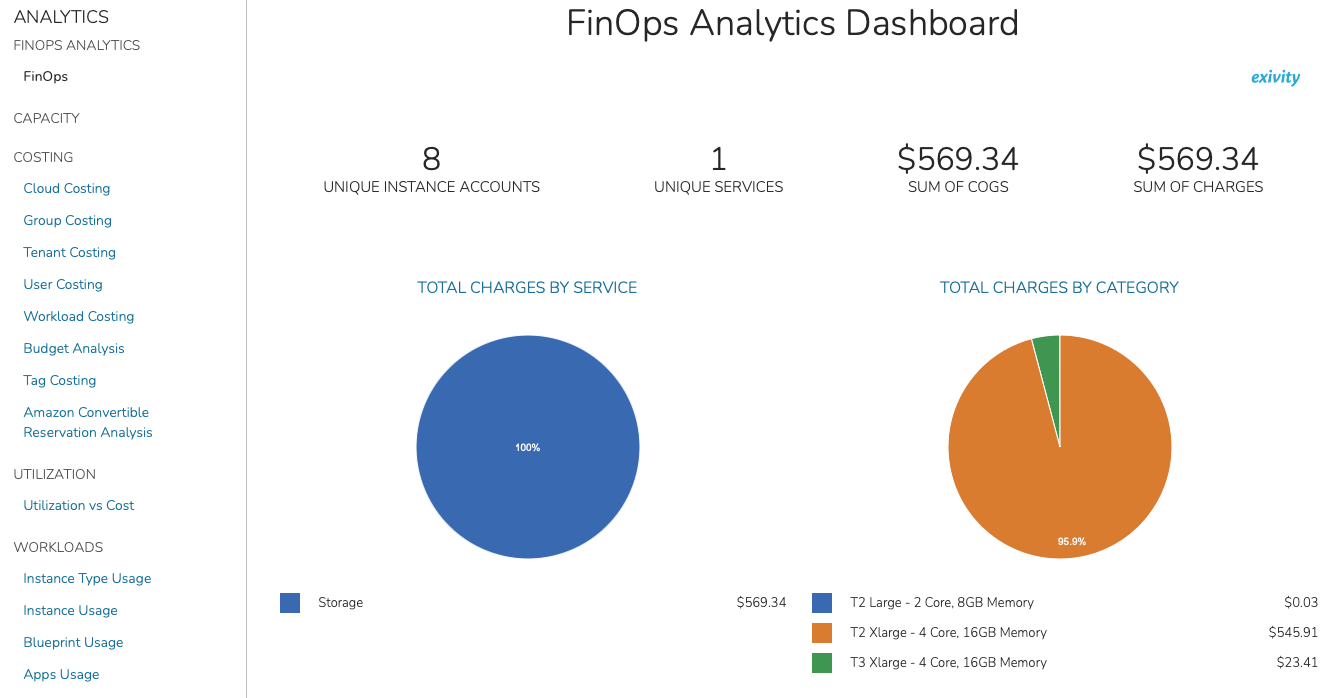
The FinOps Dashboard provides a comprehensive overview of infrastructure spending across all Morpheus instances. Key features include:
Date Range Selection and Instance Data: Select date ranges and view cost and usage data for all instances within Morpheus.
Visual Cost Breakdown:
- Total Charges by Service: A pie chart showing the proportion of total charges attributed to each service.
- Total Charges by Category: A chart that breaks down costs by service category.
This concludes the Morpheus Exivity FinOps Plugin installation and usage guide. By following these steps, you will have successfully integrated Exivity FinOps into Morpheus, allowing for seamless financial operations analysis.